Case 04 / 05 Enterprise web app · Bridgestone · via Atos
Tescam
Tire testing moved off spreadsheets onto one auditable record.
Delivered app Under NDA
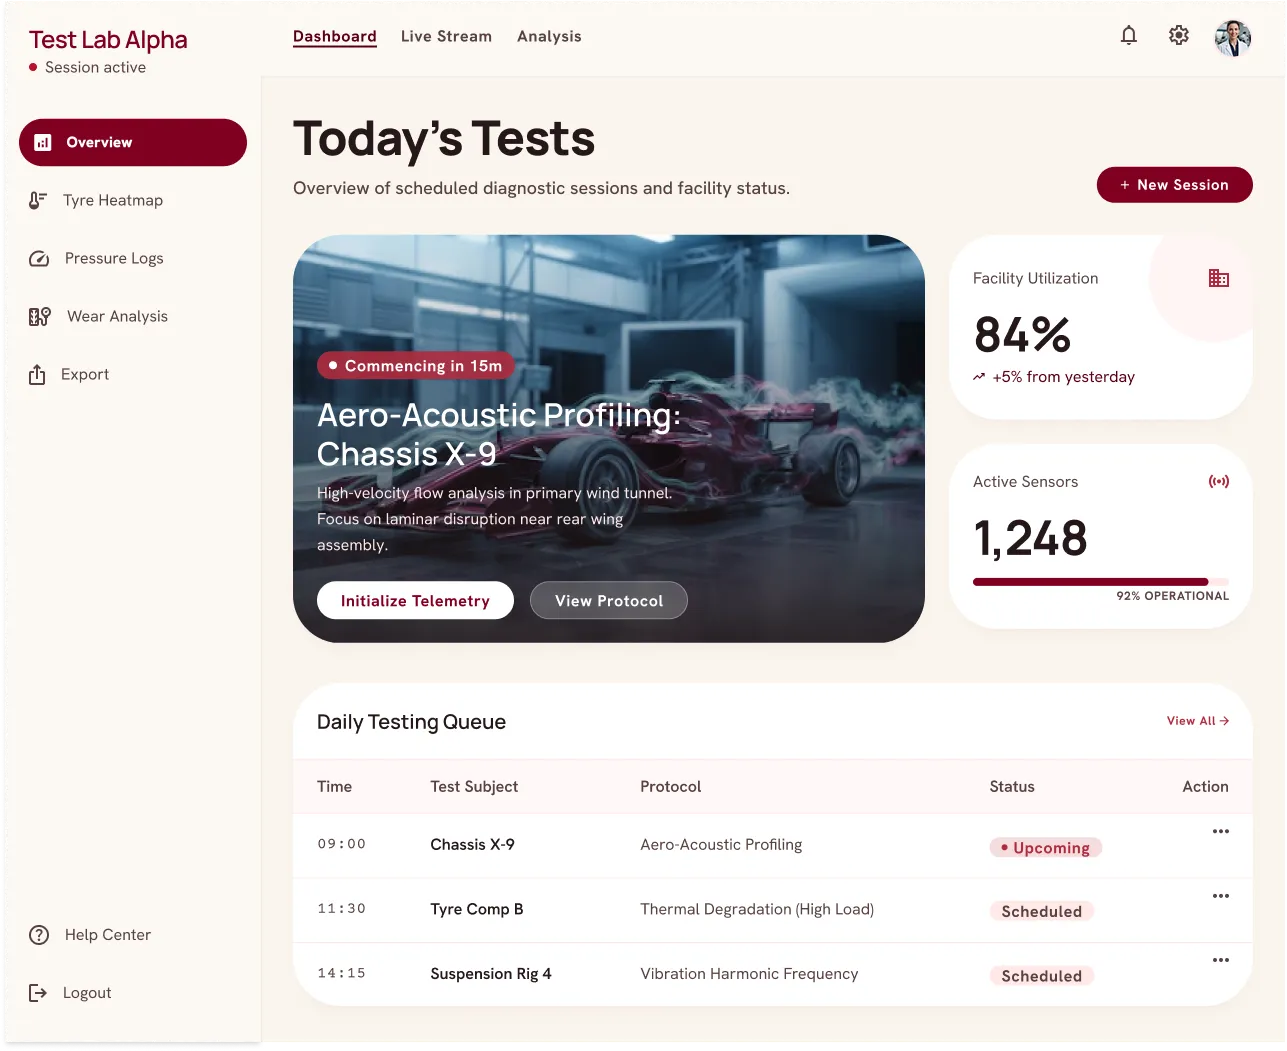
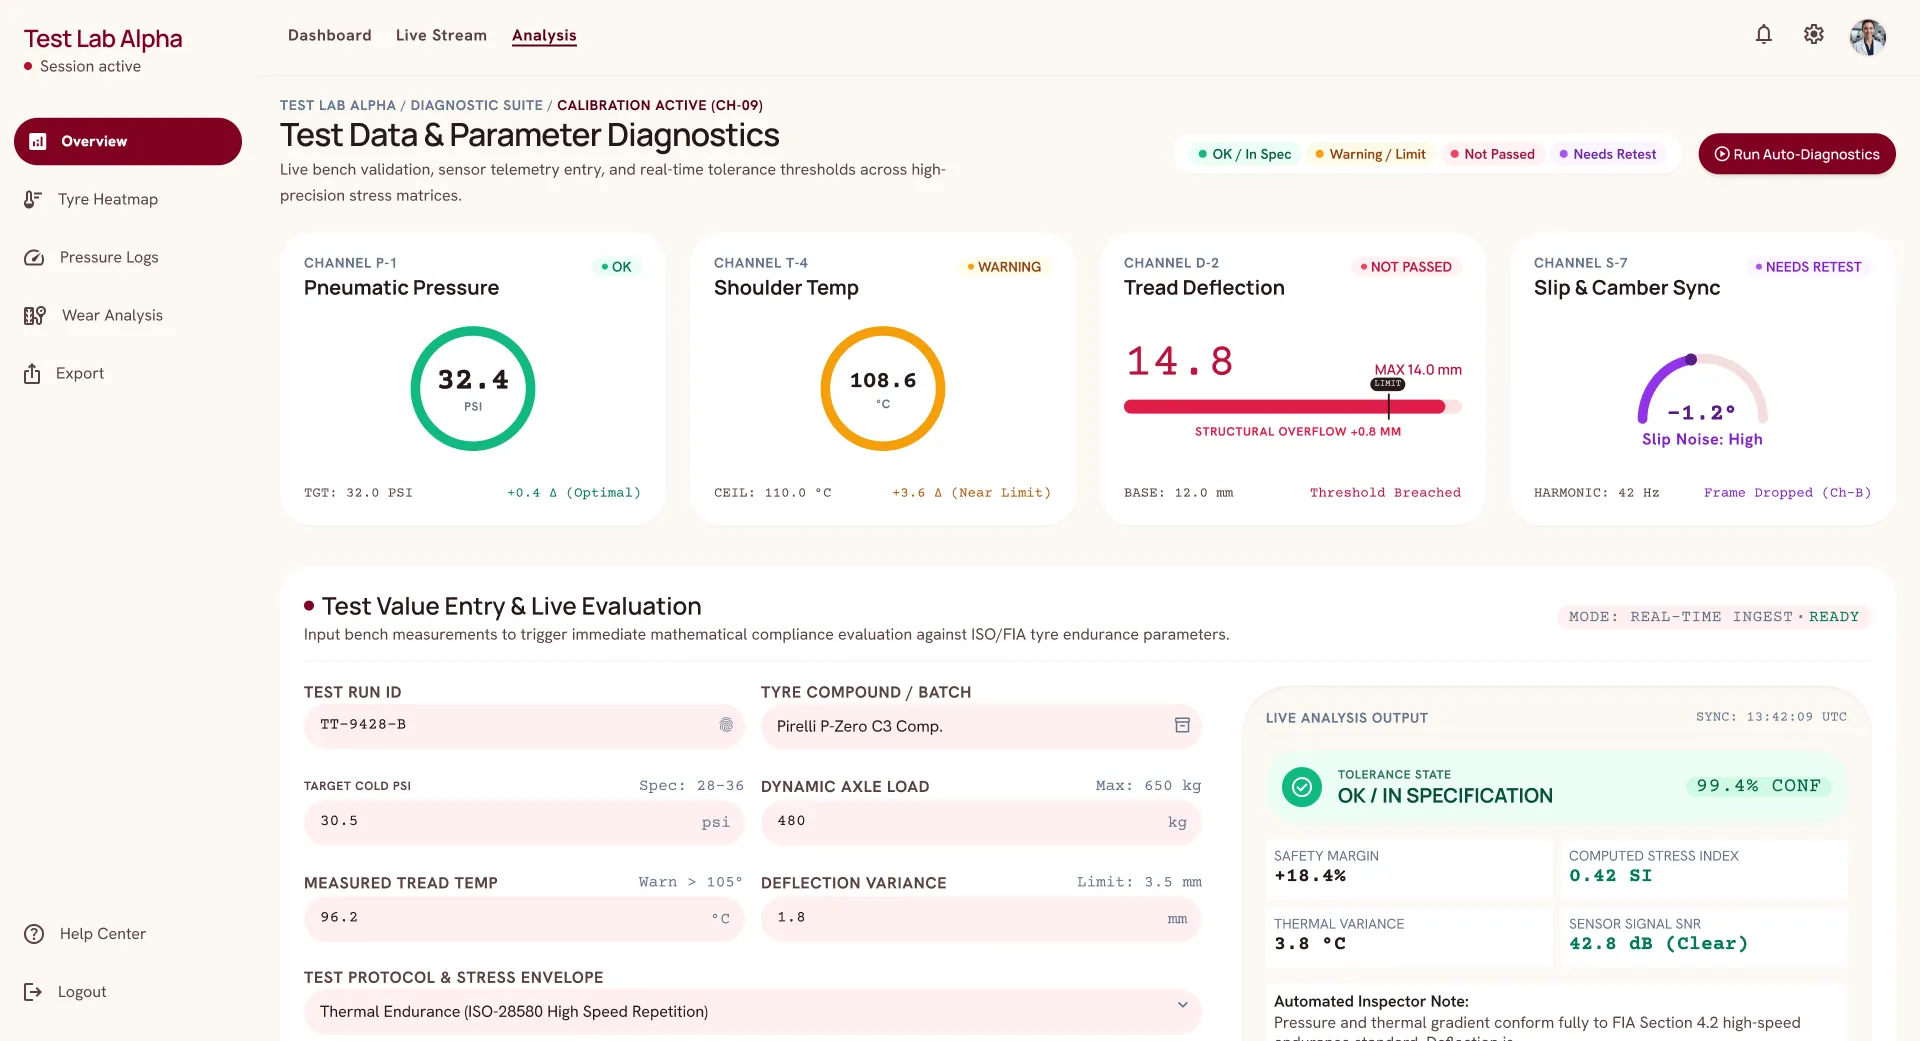
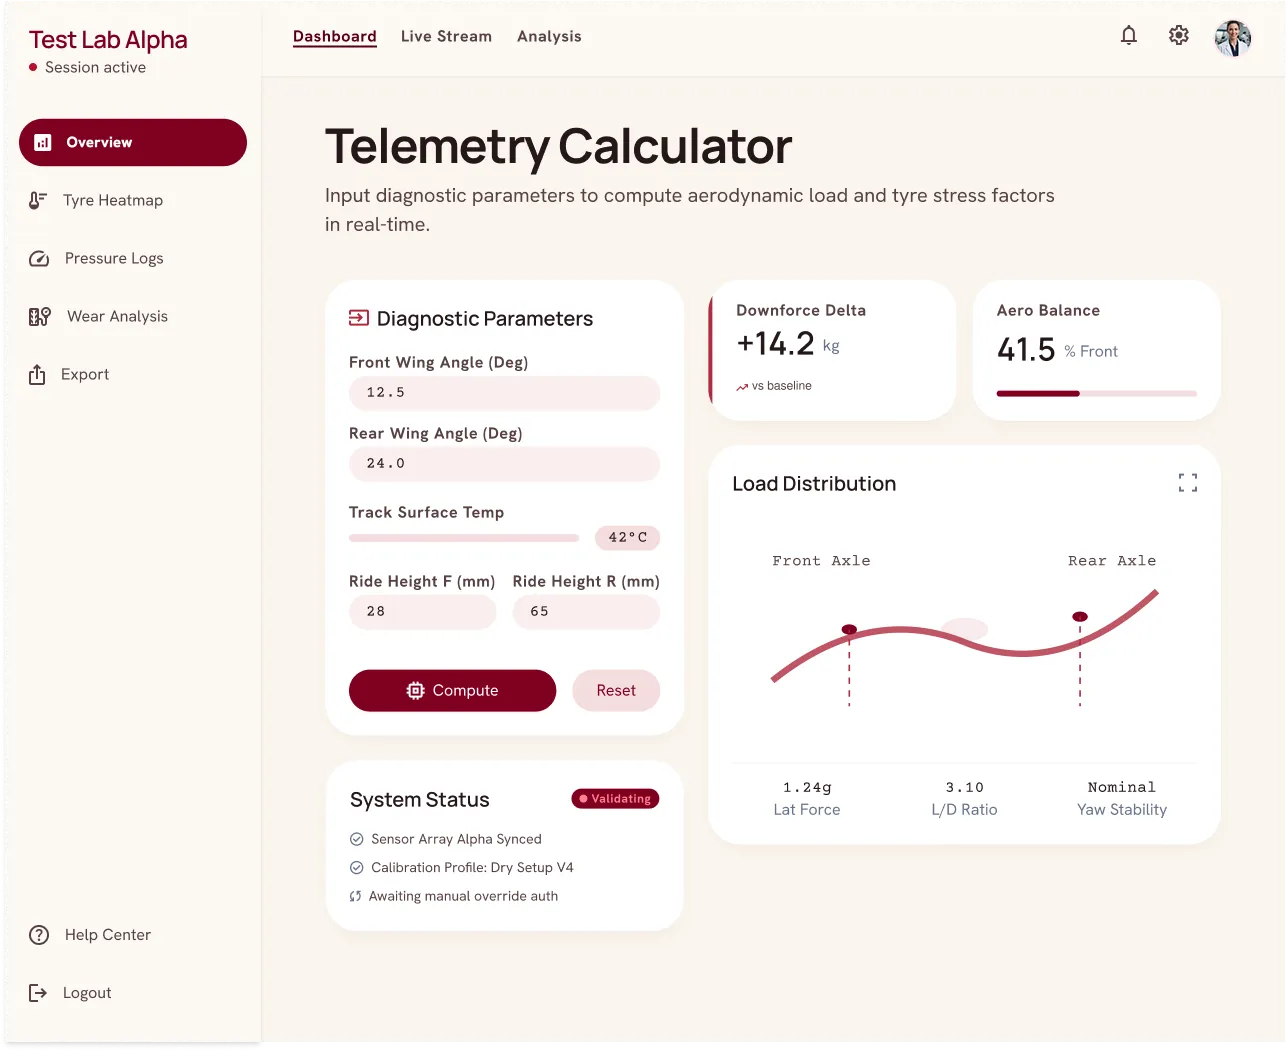
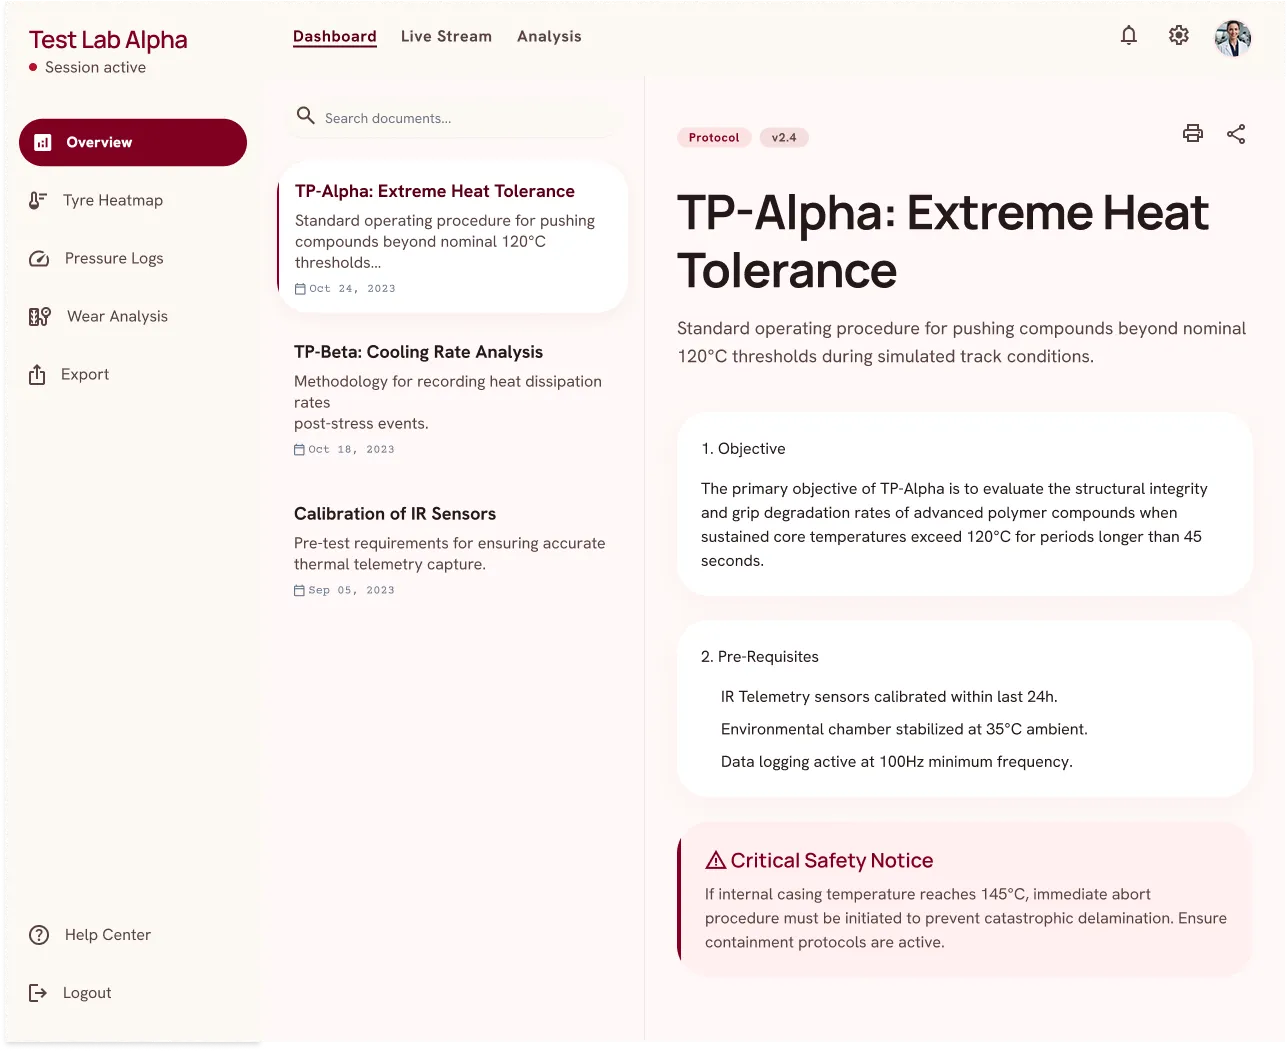
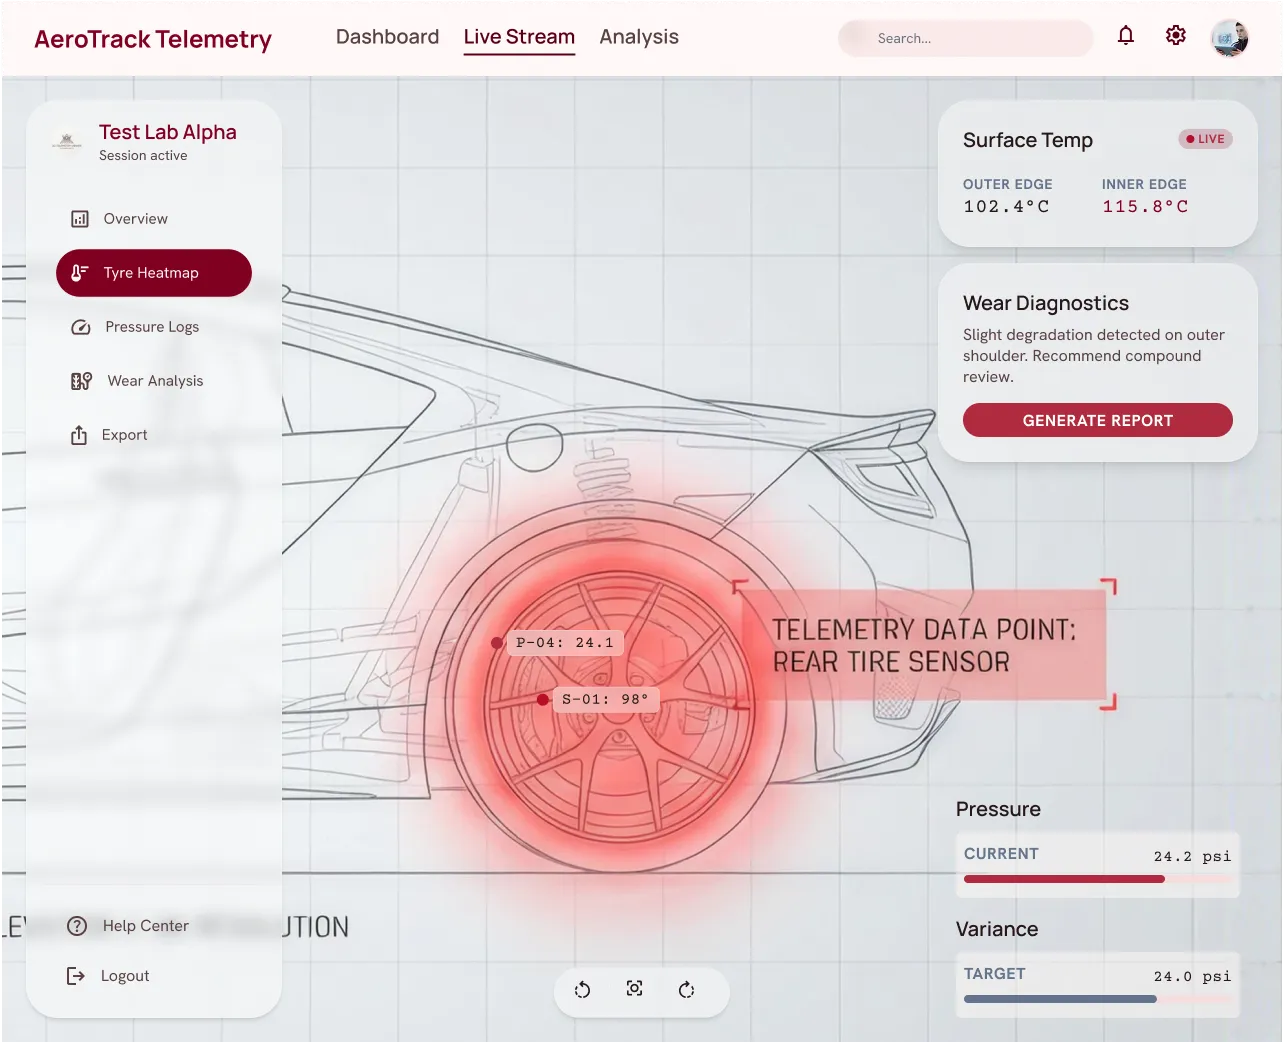
The screens below are a demonstration build, made for this portfolio to show the kind of surfaces this work produced. They are not Bridgestone’s application. The delivered work is under NDA: it is not shown here, and nothing about it (its design, its data or its behaviour) should be inferred from these images.
Fig. 0 · Tescam · product walkthrough Demonstration build · not the delivered UI
Replaced scattered spreadsheets and improvised workflows with a purpose-built enterprise web app for Bridgestone’s test engineers, the first to take the test rigs’ own telemetry, batch by timestamped batch, onto one auditable record with the procedures, scheduling and approvals.
01of 04
Context
Bridgestone’s mechanical engineers test tires, a regulated process with real safety weight behind every result. The work was coordinated through scattered Excel sheets while the test rigs were already talking: tire temperature and pressure, cycle counts, rpm, grip-measurement pads, in timestamped batches every time a test started, ran and ended, and nothing on the engineers’ side was built to receive it.
I designed the web application from scratch and carried it as product owner. Research, definition, design, and the decisions in between.
02of 04
Problem
Scheduling, data and approvals each lived in a different file, and none knew about the others. There was no single record of what had been tested or who had signed it off, so proving the trail meant chasing documents and the people who kept them.
03of 04
Process
I sat with the engineers to see the procedures as they actually happen. Then I structured the tool around the real sequence of scheduling, execution, data capture and approval, with the states and permissions a regulated process needs.
04of 04
Outcome
Testing moved off improvised spreadsheets and onto a purpose-built application. More than 5,000 rig and lab tests have run through it, and more than 1,000 real-vehicle tests were scheduled by it automatically. Scheduling had cost each of five test managers a full day every week; that is close to 200 hours a month the software now carries. One structured place to schedule procedures, receive the rigs’ telemetry, and manage approvals, with an auditable trail of what happened and who signed it.
Version history What was tried first
What it could have been
The finished screens argue for themselves. These are the forks: what was tried first, and what replaced it.
- Fork 01
Do we replace the spreadsheet?
v1Rejected
Both obvious answers: rebuilding the sheet as a web grid, or throwing sheets out on principle because the brief said “off spreadsheets”.
v2Shipped
Asking where, not whether. One page still works exactly like a sheet: for analysis against complex formulas, nothing beats it. What a sheet cannot do is assign tests and hold a running schedule; the tool takes those and leaves the rest alone.
- Fork 02
How do you move people who have used Excel since the 1990s?
v1Rejected
Arguing, training, or launching a full replacement and expecting the better product to win.
v2Shipped
A beachhead: the analysis page, the one place the tool was obviously better: no more typing by hand, configurable per user. Win that page, then build outward. Once people saw it was modular, switching stopped being a fight.
- Fork 03
Design system first, or customer feedback first?
v1Rejected
The agile default, and my own brief: involve the customer from week one and ship increments against a tight schedule.
v2Shipped
A month building a design system and component library first, with a deadline that moved to pay for it. It bought the rest of the project: later change requests were nearly all backend. As product owner it was my most exposed call, and I would make it again.
- Fork 04
Who designs the approval and audit model?
v1Rejected
Designing one: the instinct in a regulated domain is to build the governance into the product.
v2Shipped
Nobody: it already existed. Automotive arrives with its regulations and security protocols in place, testing most of all. The job was to stop the audit being slow, not to invent a second, competing definition of correct.